How did Donald Trump do in managing the economy? He ran for office as an outsider, boasting of his practical knowledge of what business needed. Between his inauguration and the beginning of the Covid pandemic in March, how well did he do? First, the big four metrics: GDP growth, unemployment, inflation, and the stock market.
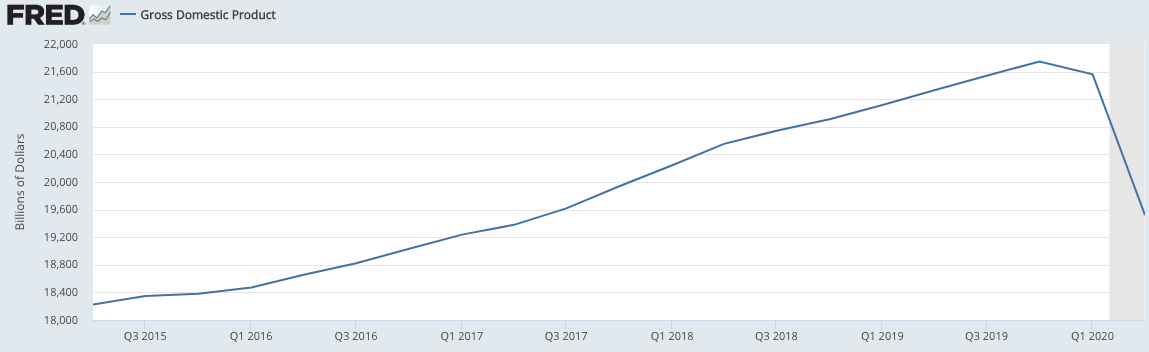
GDP growth There were promises of great results from the tax cuts, and boasts later on about how wonderful the economy was. The actual results seem good, but don’t quite match the boasts. See the following graphic courtesy of the St Louis Fed. GDP growth continued, but was not dramatic. My uninformed guess is that business investment was not as great as expected, thus the tax cut didn’t help as much as hoped. My grade is a B minus.
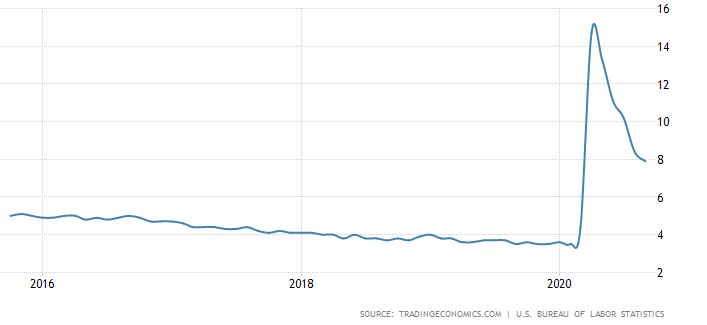
Unemployment The current definition of full employment seems to be in the 4% range. Since 2016 the unemployment rate fell steadily, ending below 4% in early 2020. See the graphic below, courtesy of tradingeconomics.com, using BLS data. My grade is an A.
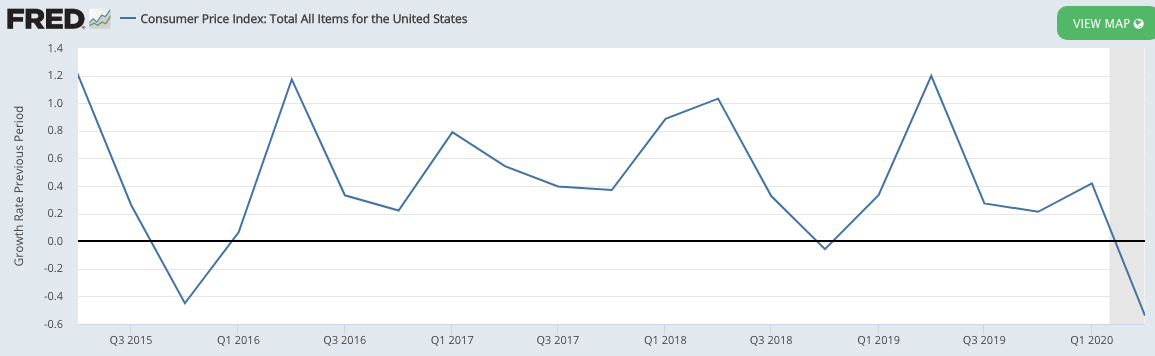
Inflation The Fed had this totally under control. The Fed Chairman and President seemed to disagree at times, but inflation remained in check. See the graphic courtesy of the St Louis Fed, showing CPI. What can you say? My grade is an A. I admit it was unearned, but it’s an A.
The stock market The stock market loves Donald Trump. Here’s a quote from a cnn.com article:
“Wall Street understands a President Joe Biden would not be good for capital. He would increase taxes on corporations and the wealthy by $4 trillion over the next decade. In June, Wall Street analysts warned clients a Biden win would be bearish for stocks.”
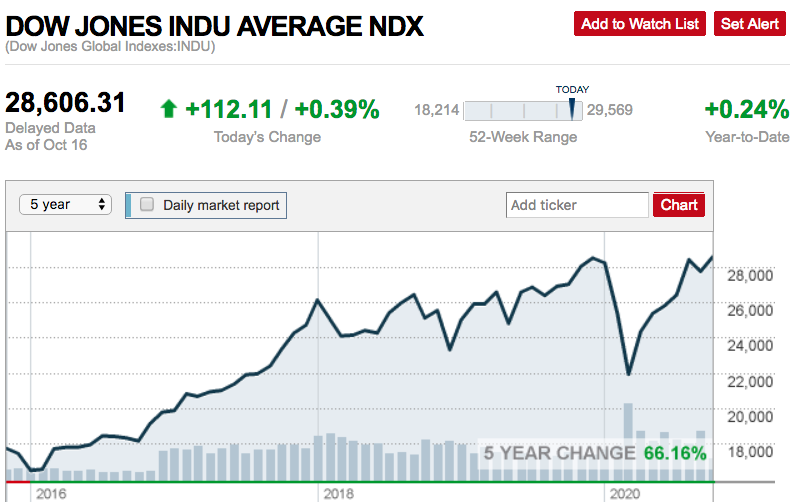
Above is a chart showing the Dow Jones index, courtesy of cnn.com. See the steady gains from early 2016 through early 2020. But…compared to what? Comparing Trump versus Obama is indeterminate. See the following quote from the Cleveland Plain Dealer.
“The Dow Jones Industrial Average increased 49% during Donald Trump’s first three years in office, topping the gains made during Barack Obama’s entire final term but falling short to-date of how much the Dow went up during Obama’s first term.”
I don’t quarrel with a market that delivers steady gains and expresses a clear preference for Trump to stay in office. If you prefer an up market versus a down market, you have to give him at least a B plus.
Income and poverty
Moving on to look at some other more-focused metrics, a Wall Street Journal editorial on 9/17/20 titled “The Higher Wages of Growth” made several assertions about the Trump economy. But it was an editorial. Exercising some skepticism I checked to see if the assertions could be verified, as follows:
1. Median household income grew 6.8%. True. See table A-1 on the US Census Bureau site “Income and Poverty in the United States: 2019”.
2. Median household incomes grew more among Hispanics, Blacks and Asians than among Whites. True. See table A-2 on the US Census Bureau site cited in #1 above. For the years 2017 – 2019:
Asian median income grew 15.6%
Black median income grew 10.6%
Hispanic median income grew 7.2%
White median income grew 6.7%
3. Median earnings increased more for women than for men. True. See table A-7 on the US Census Bureau site cited in #1 above. For the years 2017 – 2019, median earnings for males grew $1,767. For women it was $2,570.
4. Poverty fell, and fell more for minorities. True. See table B-5 on the US Census Bureau site cited in #1 above. For the years 2017 – 2019:
% Whites in poverty dropped 1.4%
% Asians in poverty dropped 2.4%
% Hispanics in poverty dropped 2.6%
% Blacks in poverty dropped 2.9%
5. The decline in childhood poverty was greater than in the Obama administration. True. See table B-6 on the US Census Bureau site cited in #1 above. For the years 2017 – 2019 childhood poverty dropped 3.0%. By contrast, for the years 2009 – 2016 it was 2.7%.
6. Income inequality declined. True, if you accept comparison of changes in top and bottom quintiles as a measure. See table A-4 on the US Census Bureau site cited in #1 above. For the years 2017 – 2019, under the heading “Shares of Household Income of Quintiles” the two top quintiles both DECLINED and the three bottom quintiles all INCREASED. The largest INCREASE was in the 2nd quintile from the bottom (8.1 to 8.3). The largest DECREASE was in the top quintile (52.3 to 51.9).
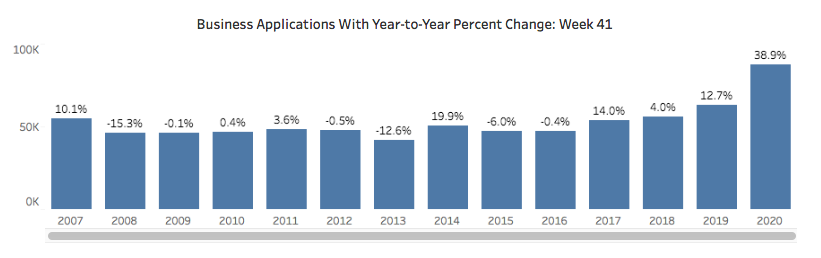
7. New business applications are higher under Trump. See the following chart, from the census.gov web site.
The Bottom Line
It’s hard to argue with success. From 2017 – 2019 Donald Trump got good results with the economy, whether you’re looking at overall metrics like GDP and unemployment, or on class, race, and gender inequality.
What about the pandemic? Once the lockdown began, economic performance was no longer a priority. All the traditional economic measures went out the window. You might compare economic results from similar countries; but how do you compare economic results from different lockdown strategies, for example Sweden vs Italy? Uncharted territory.